More Than One Million Properties Have Seen Their EPC Ratings Downgraded
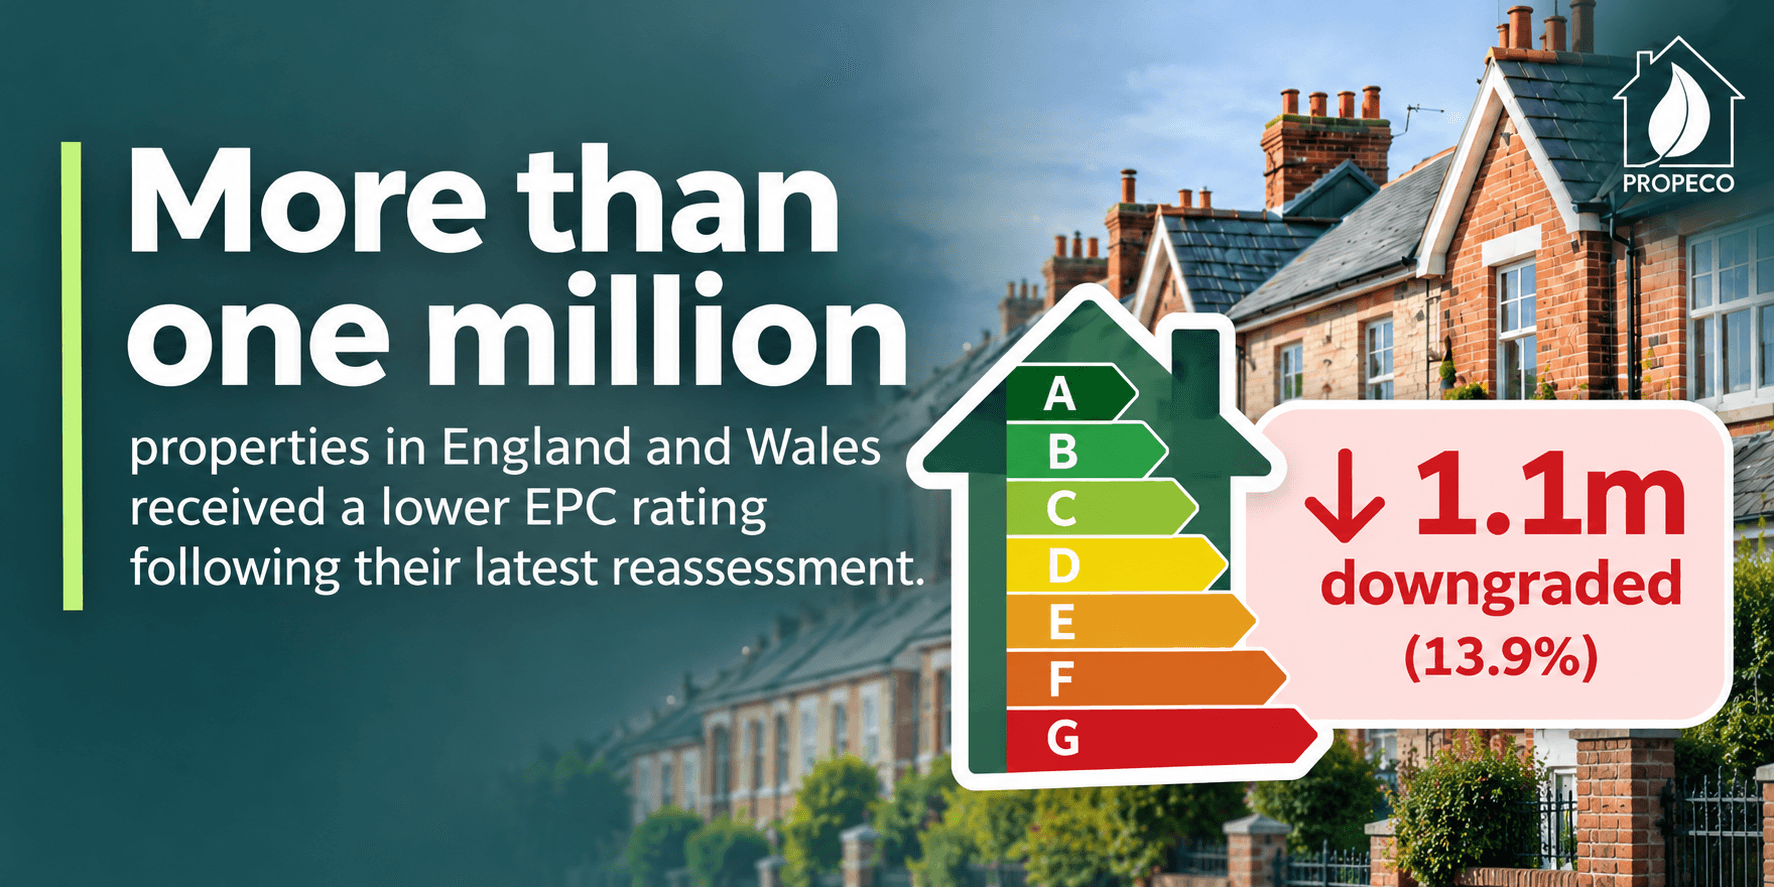
New analysis by PropEco of 7.7 million properties in England and Wales reveals that nearly 14% received a lower Energy Performance Certificate (EPC) rating following their latest recorded reassessment, raising important questions about the reliability of historical EPC data.
Energy Performance Certificates (EPCs) have become an increasingly important part of the UK property market. Originally introduced to help buyers and tenants understand the energy efficiency of buildings, they are now used by lenders, investors, landlords and property professionals to inform a growing range of financial, regulatory and investment decisions.
An EPC provides an assessment of a property's energy efficiency, including an overall rating from A (most efficient) to G (least efficient), estimated energy costs and recommendations for improvements.
However, EPC ratings are often treated as relatively fixed characteristics of a property. While improvements such as additional insulation, more efficient heating systems or better glazing can increase a property's rating, less attention is paid to the possibility that a subsequent assessment might produce a lower result.
This matters because EPC thresholds can have significant implications for property owners, potentially affecting the ability to let a property, access to finance and the cost of meeting energy-efficiency requirements.
Our analysis of historical EPC records across England and Wales reveals just how frequently ratings change, and why relying on an older certificate may introduce risks that are not immediately apparent.
Nearly 14% of reassessed properties received a lower EPC rating
We analysed approximately 7.7 million properties in England and Wales with at least two recorded EPC assessments, comparing the two most recent certificates for each property.
The results show that:
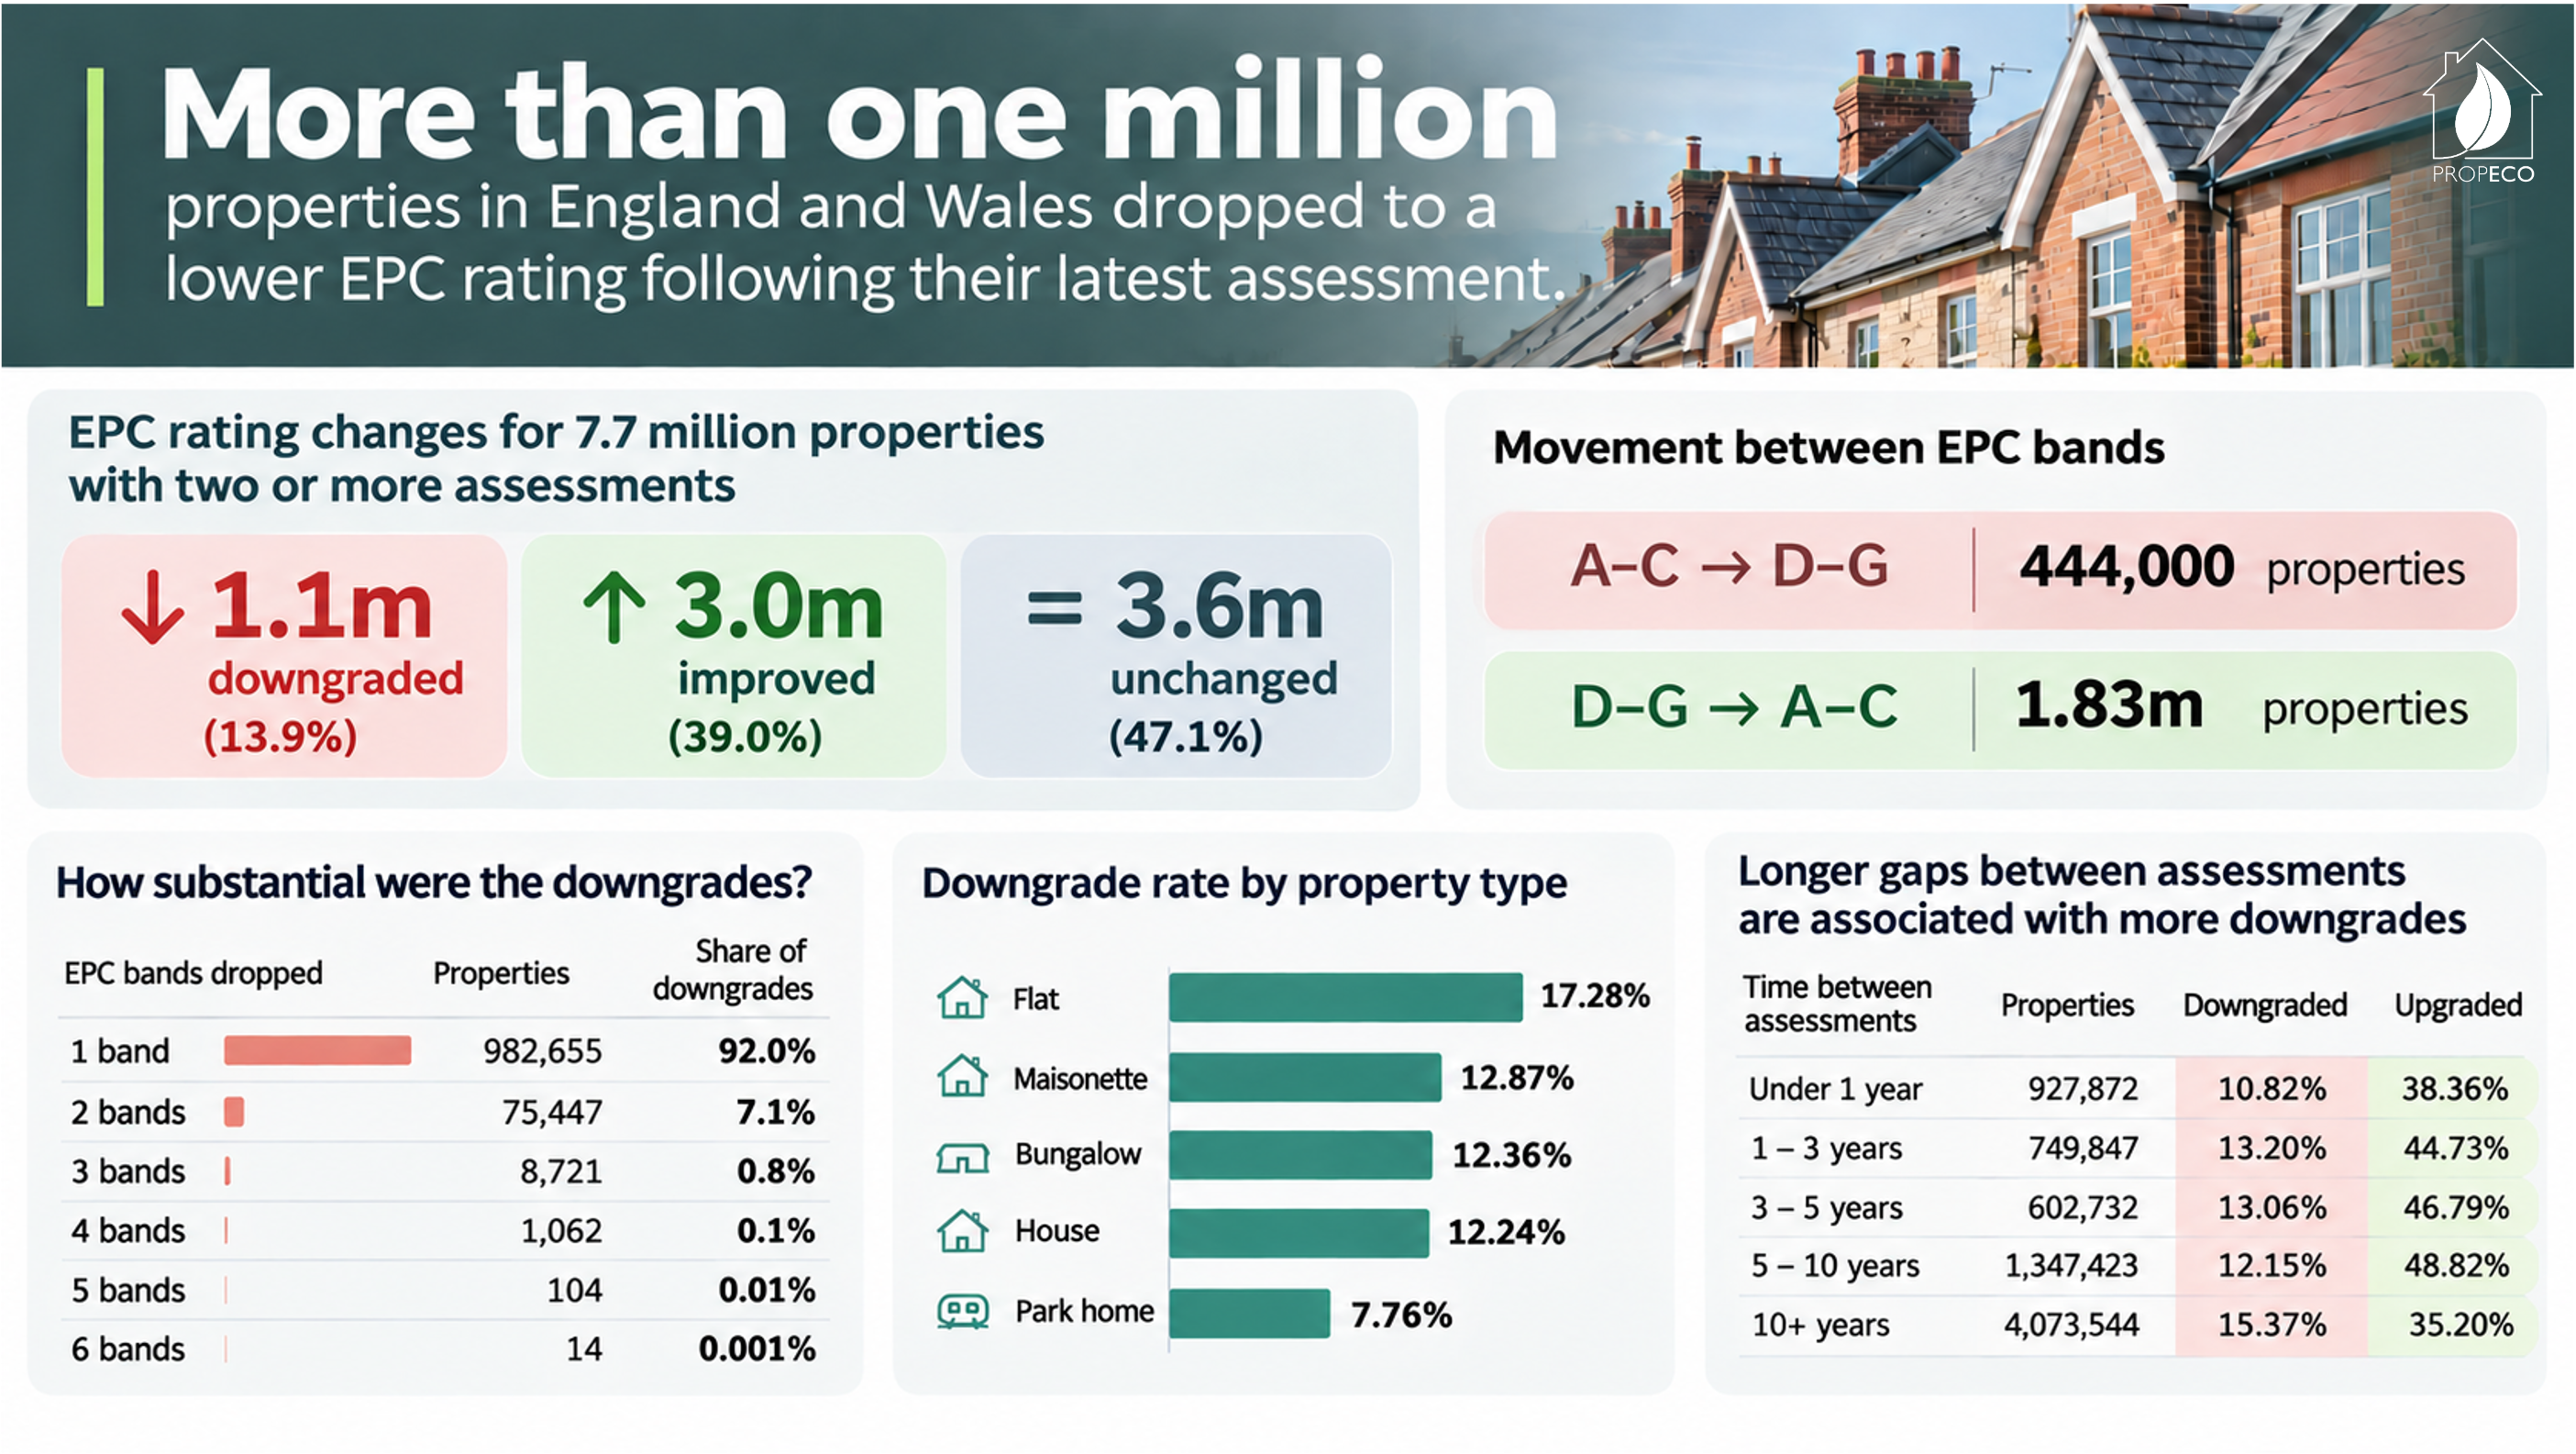
- 1.07 million properties (approximately 13.9%) received a lower EPC band.
- Around 3 million properties (39%) received an improved rating.
- Approximately 3.6 million properties (47%) remained in the same EPC band.
Although improvements were substantially more common than downgrades, the number of properties receiving a lower rating is significant.
Importantly, these figures describe changes in assessed energy efficiency, rather than necessarily reflecting equivalent changes in the physical performance of the properties themselves.
How substantial were the downgrades?
The majority of properties receiving a lower EPC rating dropped by just one band.
| EPC bands dropped | Properties | Share of downgrades |
|---|---|---|
| 1 band | 982,655 | 92.0% |
| 2 bands | 75,447 | 7.1% |
| 3 bands | 8,721 | 0.8% |
| 4 bands | 1,062 | 0.1% |
| 5 bands | 104 | 0.01% |
| 6 bands | 14 | 0.001% |
Nevertheless, 85,348 properties fell by two or more EPC bands, including almost 10,000 that dropped by three or more.
A particularly important finding concerns properties crossing the boundary between the higher EPC bands (A–C) and lower bands (D–G).
Approximately 444,000 properties moved from A–C to D–G, while around 1.83 million moved in the opposite direction.
These transitions can have practical consequences. For example, a property previously rated C that receives a D rating may face additional improvement requirements if a relevant regulatory or lending threshold applies.
The findings also illustrate why organisations should be cautious about assuming that a property's historical EPC band will necessarily be maintained when a new certificate is issued.
Flats were more likely to receive a downgrade
The likelihood of an EPC downgrade also varied by property type.
| Property type | Properties reassessed | Downgrade rate |
|---|---|---|
| Flat | 2,453,140 | 17.28% |
| Maisonette | 213,572 | 12.87% |
| Bungalow | 591,456 | 12.36% |
| House | 4,439,372 | 12.24% |
| Park home | 3,878 | 7.76% |
Flats had the highest overall downgrade rate, with approximately one in six receiving a lower rating.
At first glance, this might suggest that flats are inherently more susceptible to EPC downgrades than houses.
However, a more detailed examination reveals an important qualification.
Flats are substantially more likely to have started with relatively high EPC ratings. Among reassessed properties, approximately 57% of flats had previously been rated A–C, compared with just 27% of houses.
When we compared houses and flats starting from the same EPC band, houses actually had higher downgrade rates in most bands.
For example, among properties previously rated B, 71.5% of houses were subsequently downgraded, compared with 55.8% of flats.
This illustrates an important statistical consideration: differences in the starting characteristics of property groups can significantly influence comparisons of their overall downgrade rates.
Does the age of an EPC matter?
Another interesting finding concerns the length of time between assessments.
| Time between assessments | Properties | Downgraded | Upgraded |
|---|---|---|---|
| Under 1 year | 927,872 | 10.82% | 38.36% |
| 1–3 years | 749,847 | 13.20% | 44.73% |
| 3–5 years | 602,732 | 13.06% | 46.79% |
| 5–10 years | 1,347,423 | 12.15% | 48.82% |
| 10+ years | 4,073,544 | 15.37% | 35.20% |
Properties reassessed after ten or more years had the highest downgrade rate, at 15.37%.
By comparison, properties reassessed within one year had a downgrade rate of 10.82%.
The relationship is not entirely linear, but the results suggest that the age of an existing certificate is an important consideration when assessing the likelihood of a different rating being recorded.
Longer intervals create more opportunities for changes in the property, its recorded characteristics and the assessment methodology used.
However, the analysis does not establish that the passage of time itself causes downgrades. Differences between assessment cohorts and the reasons for reassessment may also influence the results.
Why do EPC ratings fall?
A lower EPC rating does not necessarily mean that a property's actual energy efficiency has deteriorated.
Several factors can contribute to changes between assessments.
Changes to the property. Alterations to heating systems, insulation, glazing or other building characteristics can affect an EPC rating. Some changes improve assessed performance, while others may reduce it.
Changes in assessment methodologies. EPC calculations rely on standardised methodologies and assumptions, which have evolved over time. A property assessed using an earlier methodology may receive a different score when reassessed under a newer version.
Differences in recorded information. EPC assessments depend on information about a property's construction, insulation, heating and other characteristics. Where details cannot be verified, assessors may be required to use standard assumptions. Differences in the information available or recorded can influence the outcome.
Assessment errors. Incorrect measurements, data entry errors and inconsistent recording practices can also contribute to changes between certificates.
These factors make it difficult to interpret an EPC downgrade as direct evidence of a corresponding deterioration in a property's physical energy performance.
Indeed, some of the patterns identified in our analysis suggest that changes in assessment practices and recorded information may be important areas for further investigation.
Why this matters for lenders, investors and property owners
As EPC ratings become increasingly important to property-related decisions, the implications of a downgrade extend beyond the certificate itself.
For lenders, an EPC rating may contribute to assessments of property portfolios, energy-efficiency targets and potential retrofit requirements.
For investors and landlords, a lower rating could affect the cost of meeting applicable energy-efficiency standards, particularly where properties fall below relevant regulatory thresholds.
For homeowners and buyers, an outdated EPC may create uncertainty about the energy efficiency of a property and the improvements that might be required.
These issues are particularly relevant when organisations are analysing large property portfolios using historical EPC data.
A portfolio containing thousands of properties rated C, for example, may not necessarily retain the same distribution of ratings if those properties were reassessed today.
Understanding when certificates were issued, how assessments were conducted and how ratings have changed historically can therefore provide important context.
Looking beyond the EPC rating
EPCs remain a valuable source of information about the energy efficiency of buildings. However, they are assessments conducted at a particular point in time, using the information and methodology available.
Our findings demonstrate that EPC ratings can change substantially between assessments, and that those changes are not always straightforward to interpret.
For organisations relying on EPC data, this highlights the importance of considering more than simply the latest recorded A–G rating.
Certificate age, historical assessments, property characteristics and the potential for reassessment outcomes to differ all deserve consideration.
As EPC ratings become increasingly important to property-related decisions, understanding the reliability and limitations of individual assessments is essential.
About the analysis
This analysis was conducted by PropEco using historical domestic EPC records for England and Wales. It compares the two most recent recorded certificates with valid EPC ratings for properties with at least two assessments, identified using Unique Property Reference Numbers (UPRNs).
The findings describe changes in recorded EPC ratings and should not be interpreted as direct measurements of changes in actual energy consumption or physical building performance.
Results are rounded where appropriate.